The US stock order book displays multi-level bid/ask information through depth charts, depth quotes, and order details. It helps you analyze the distribution of order quantity across price levels, compare buying/selling forces, and assess market liquidity. You can change the number of price levels displayed and view detailed order sources.
1. Feature Overview
1.1 Depth Chart
The depth chart shows order quantities across 60 levels of bid and ask prices. The chart structure does not change with the number of levels.
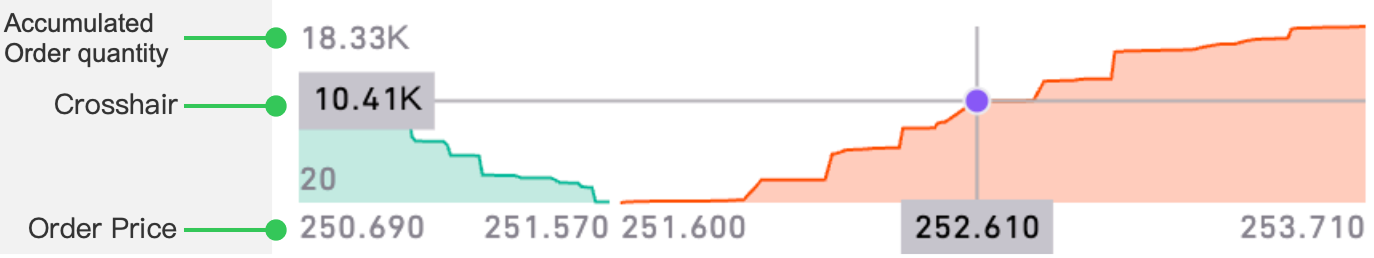
- Horizontal axis: Displays the order price. The four prices from left to right are the lowest price of the 60-level bids, the highest price of the 60-level bids (Bid 1), the lowest price of the 60-level asks (Ask 1), and the highest price of the 60-level asks.
- Vertical axis: Displays the accumulated order quantity, indicating the order quantity required to reach a specific price level. The bottom value is the smaller of the Bid 1 or Ask 1 quantity, and the top value is the larger of the total 60-level bid or ask quantities.
- Crosshairs: Long-press on the chart to activate a crosshair that snaps to the chart line. When sliding, the axis displays the current price level and accumulated order quantity needed to reach it.
By observing the depth chart, you can visually gauge the number of bid and ask orders at a certain price level, thereby understanding the strength of buying and selling forces:
- Width: Reflects order price dispersion.
- Height: Reflects total bid/ask quantity trends.
- Slope: Reflects price levels with more orders and the corresponding order quantities.
1.2 Depth quotes
This feature provides detailed bid/ask quotations covering up to 60 price levels, allowing you to flexibly select viewing market depths of 1, 5, 10, 20, 40, or 60 levels.
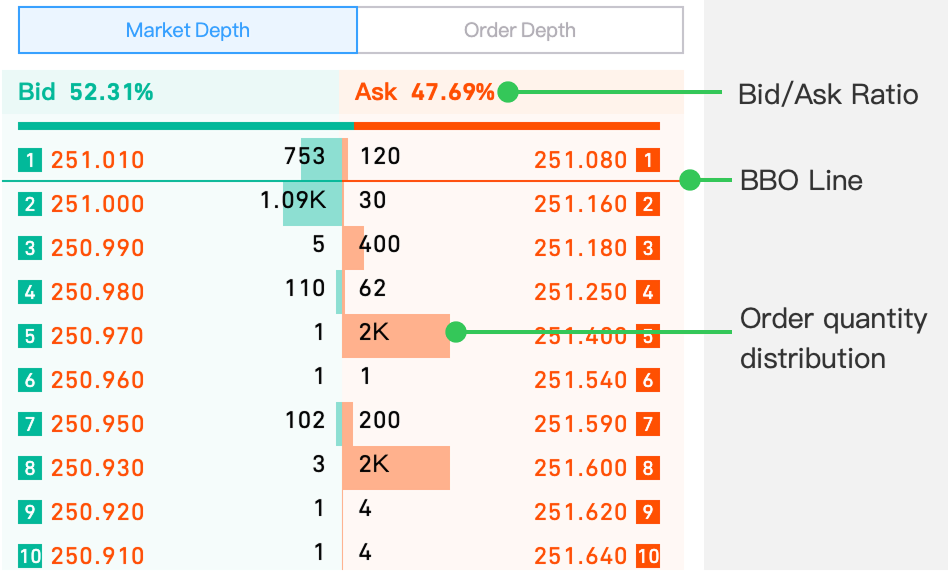
Bid/Ask Ratio:
- Bid ratio = Nasdaq's total bid quantity/Total order quantity. Where, Total order quantity = Total bid quantity + Total ask quantity.
- Ask ratio = Nasdaq's total ask quantity/Total order quantity.
Note: The bid/ask ratio reflects the distribution of all Nasdaq orders, not limited to the top 60 levels.
BBO Line:
Highlights orders within the Best Bid and Offer (BBO) spread on order book.
- Bid side: Orders with prices higher than or equal to the best bid price are displayed above the BBO line.
- Ask side: Orders with prices lower than or equal to the best ask price are displayed above the BBO line.
| BBO Type | Description |
| Nasdaq BBO (NSDQ BBO) | TotalView and Nasdaq BBO are both based on data from Nasdaq Exchange. Thus, level 1 quotes in TotalView are the same as that of Nasdaq BBO. |
| National BBO | National BBO aggregates optimal quotes from all 17 US exchanges, excluding odd-lot orders. Therefore, when comprehensive US market data is displayed, the BBO line on TotalView may span multiple price levels. |
Order quantity distribution:
The distribution of the order quantities is visualized through a horizontal bar chart.
The longest bar (100% length) represents the maximum order quantity within the selected levels. The bars of other levels scale proportionally based on their order quantities relative to this maximum.
Note: On the quote page, the longest bar represents the maximum quantity within user-selected levels. On the full-screen page, the longest bar represents the maximum quantity across 60 levels by default.
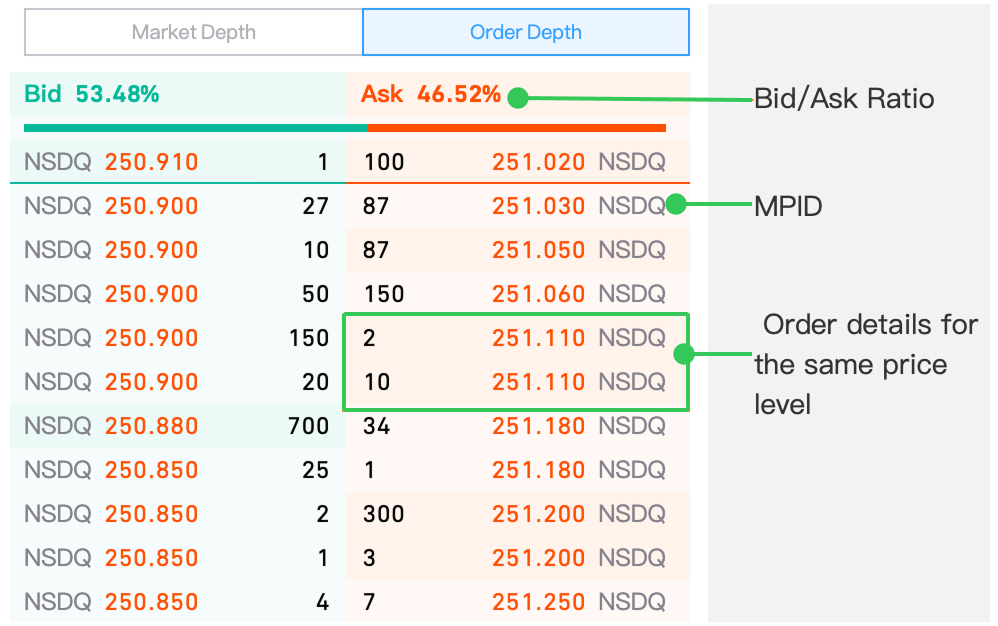
1.3 Order details
This feature displays order details at each price level.
- Market Participants ID (MPID) identifies the market participant. If market participants do not provide MPID when submitting orders, NSDQ will be displayed by default during pre-market, regular trading, and after hours, indicating that the orders come from the Nasdaq Exchange. BLUE will be displayed by default during overnight hours, indicating that the orders come from the Blue Ocean Exchange.
- The bid/ask ratio and BBO line rules follow the Depth Quote standards.
2. Differences Between order book and BBO
| Feature | NSDQ BBO | National BBO | Order Book |
| Description | Nasdaq BBO | BBO from all 17 US exchanges | 60-level market depth |
| Quote level | Level 1 | Level 1 | Level 2 |
| Exchange | Nasdaq | All 17 US exchanges | Nasdaq and Blue Ocean |
| Quotelevels | 1 bid/ask level | 1 bid/ask level | 60 bid/ask levels |
| Order details | None | None | Yes |
| Depth Chart | None | None | Yes |
FAQs
Q1: During which trading sessions can I obtain order book data?
| Tradinghours | Order bookdata |
| Pre-market trading | Nasdaq TotalView |
| Regular trading hours | Nasdaq TotalView |
| After hours | Nasdaq TotalView |
| Overnight trading | Blue Ocean LV2 |
| Market closed | None |
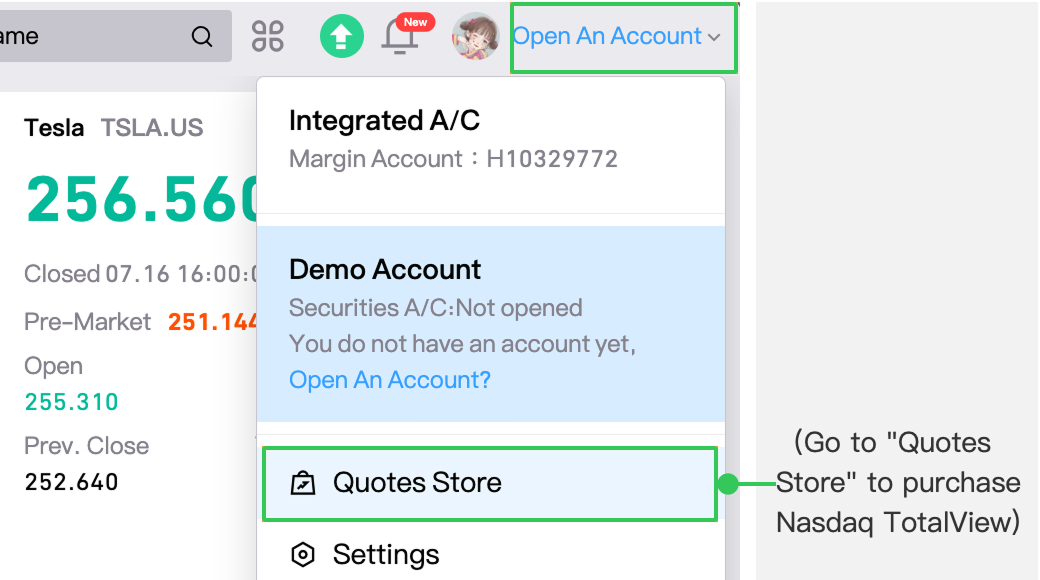
Q2: How can I obtain order book access?
Tap Open An Account > Quotes Store to purchase access to quote data.
Q3: Why is no data shown after launching the app even though I have purchased access to order book?
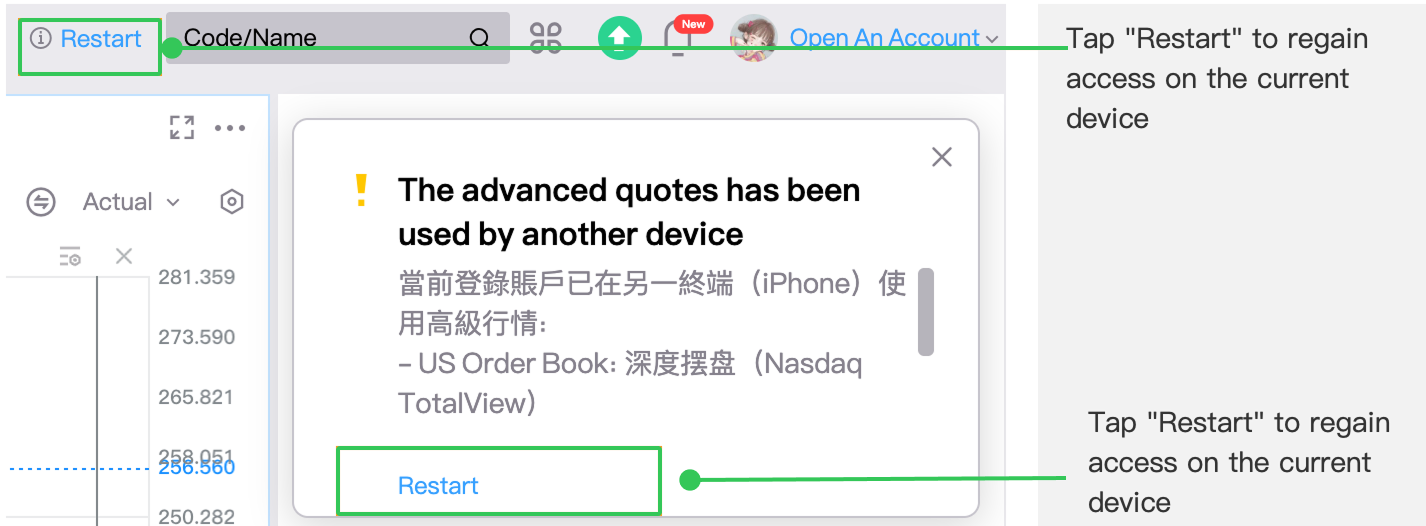
According to exchange requirements, advanced quote data subscriptions are restricted to a single device. When you log in multiple devices simultaneously, only the latest logged-in device retains data access, and a resource preemption notification will be displayed on the previously logged-in device.
You can tap Restart on the current device to regain access to order book.
Key Takeaways: Depth charts, depth quotes, and order details visualize multi-level bid/ask quantity distribution, helping you understand the strength of buying and selling forces and liquidity. The bid/ask ratio reflects order quantity structure, and BBO lines indicate optimal price ranges. In the bar chart, bar length scales in proportion to the maximum order quantity. Long-press on the depth chart to activate a crosshair and check the price and the corresponding accumulated order quantity needed. The number of price levels displayed can be changed. You can purchase access to order book by tapping Open An Account > Quotes Store. The access is limited to one device only. You can tap Restart to restore access on the current device.
Disclosures
This article is for reference only and does not constitute any investment advice.
- Business / KOL Partnership
- nz@longbridge.global
- Public Relations
- nz@longbridge.global
- Terms and Conditions
- Customer Agreement
- Privacy Policy
- Risk Disclosure
- Disclaimer
- Disclosure Statement

A New Zealand registered Financial Service Provider (FSP number: FSP600050), and is a member of the Financial Dispute Resolution Scheme, a New Zealand independent dispute resolution service provider.

A licensed corporation recognized by the SFC (CE No. BPX066). Holder of License Types 1 (Dealing in Securities), 2 (Dealing in Futures Contracts), 4 (Advising on Securities) and 9 (Asset Management). Also a registered HKEX participant and HKSCC participant.

Registered with the Monetary Authority of Singapore (MAS), Long Bridge Securities Pte. Ltd. is a Capital Markets Services Licence holder and Exempt Financial Adviser (Licence No. CMS101211).

A broker dealer registered with the Securities and Exchange Commission (SEC)(CRD: 314519/SEC: 8-70711), a member of the Financial Industry Regulatory Authority (FINRA) and Securities Investor Protection Corporation (SIPC).